

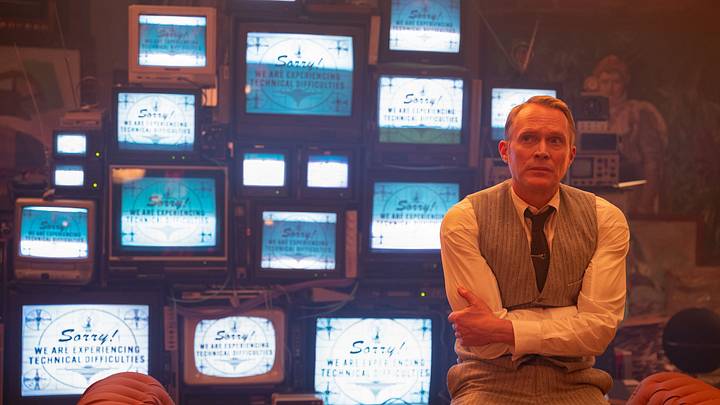
VisionQuest has been making waves for all the right reasons. The latest Marvel Cinematic Universe show was released to critical acclaim, earning an astounding 91% approval score on Rotten Tomatoes and nearly matching WandaVision's 92% score.
Additionally, audiences have been drawn in by the complex arcs of many artificial intelligences trying to find their place in the world and the mystery of who The Client really is. The last installment in the WandaVision trilogy is firing on all cylinders, and the best is yet to come as we get closer to the finale. But has this success translated into high viewership numbers?
As revealed by tracking company Luminate, VisionQuest was watched for 639 million minutes during its first ten days on air. An important detail to consider is that this figure is divided across four episodes total—two of which were released on premiere day, while the other two hit the small screen a week later. So did this figure translate into a major success story for Marvel Studios?

VisionQuest is highly likely to be the least-watched project of the WandaVision trilogy
It's a bit tricky to compare VisionQuest's performance to other MCU series. For starters, we don't know how many minutes each Disney+ project was watched exactly ten days after release. Part of the problem is that every show could premiere on a different day of the week, while analytics companies (mostly) pull the data on a weekly basis.
For example, The Falcon and the Winter Soldier was released on Friday, March 19, 2021. According to Nielsen's Top 10 charts, the show was viewed 495 million minutes for the week of March 15 to 21. That means those 495 million minutes were gathered over the course of three days—Friday, Saturday, and Sunday. That's perfect for our analysis, as we can then see how much the show was watched during its second week (which was 628 million minutes from March 22 to 28). Then we add these two quantities to get the show's performance during its first ten days (1,123 million minutes watched).
On the flip side, series like Loki premiered on a Wednesday (June 9, 2021). That means the analytics pulled for the week of June 7 to 13 equate to the show's first five days on air. If we add to that the viewership numbers obtained during the series' second week on air, we'd obtain the data for 12 days total instead of ten. So, bearing in mind that we don't have the exact analytics for every MCU show exactly ten days after its release, here's how VisionQuest fares against other heavy hitters:
- The Falcon and the Winter Soldier - 1.123 million minutes during its first 10 days across 2 episodes
- WandaVision - 808 million minutes during its first 10 days across 3 episodes
- Loki Season 1 - 731 million minutes during its first 7 days across 1 episode
- VisionQuest - 639 million minutes during its first 10 days across 4 episodes
- Wonder Man - 549.6 million minutes during its first 10 days across 8 episodes
- Agatha All Along - 426 million minutes during its first 7 days across 2 episodes
Now, there's another key detail to take into consideration. During its first ten days on air, Marvel released 4 episodes of VisionQuest. By contrast, the studio only released two episodes of The Falcon and the Winter Soldier during that same timeframe. So the difference in average minutes watched per episode between these two projects is absolutely striking.

To get the average number of minutes a single episode of VisionQuest was viewed during its first ten days, we'd have to divide 639 million minutes by four episodes. That would give us an average of 159.75 million minutes per episode.
To give a much more equitable comparison, we divided the results showcased above by the number of episodes each MCU show aired during its first seven or ten days on air. So, without further ado, here's how many viewership minutes a single episode averaged per show:
- Loki Season 1 - 731 million minutes averaged per episode during its first 7 days
- The Falcon and the Winter Soldier - 561.5 million minutes averaged per episode during its first 10 days
- WandaVision - 269.3 million minutes averaged per episode during its first 10 days
- Agatha All Along - 213 million minutes averaged per episode during its first 7 days
- VisionQuest - 159.7 million minutes averaged per episode during its first 10 days
- Wonder Man - 68.7 million minutes averaged per episode during its first 10 days
Looking at these numbers, it's clear the undisputed winner of the WandaVision trilogy during its first ten days on air was WandaVision itself. Interestingly, Agatha All Along likely came in second place, as it has a higher average number of minutes viewed per episode during its first seven days than VisionQuest averaged during its first ten days. This means it is very likely that Agatha had more overall viewers during this timeframe. After all, we also have to consider that the average runtime of a VisionQuest episode is longer than the average runtime of an Agatha All Along episode, which makes these results even more significant.
Granted, it's important to remember these metrics aren't perfect. If four friends got together to watch a single minute of an episode, it would still be tracked as one minute as opposed to four. On the opposite end of things, maybe a single person watched the same episode twice, which increases the total number of minutes viewed per episode.
More importantly, every single episode across these shows has a different runtime, which means a single person watching a one-hour episode of one project would equate to two people watching a 30-minute episode of another. That's why it's tricky to analyze minutes watched per unit of time as opposed to viewers per episode. That said, it's still likely Agatha All Along performed better than VisionQuest during its first ten days on air.
While VisionQuest may have had a low start in terms of viewers, it will be interesting to see what the show's final numbers look like after all episodes have been released.
 Add us as a preferred source on Google